Crowdly
Add to Chrome
PSY230M-1-Spring 2025 - CAS - Introduction to Statistical Methods and Experimental Design (PSY230M1202551)
Looking for PSY230M-1-Spring 2025 - CAS - Introduction to Statistical Methods and Experimental Design (PSY230M1202551) test answers and solutions? Browse our comprehensive collection of verified answers for PSY230M-1-Spring 2025 - CAS - Introduction to Statistical Methods and Experimental Design (PSY230M1202551) at moodle.bethel.edu.
Get instant access to accurate answers and detailed explanations for your course questions. Our community-driven platform helps students succeed!
Which of the following situations is MOST appropriate for a Chi Square test of independence?
0%
0%
0%
0%
View this question
APA style helps with which of the following?
0%
0%
0%
0%
View this question
A teacher wants to know the most common test score in a class. Which measure of central tendency should they use?
0%
0%
0%
0%
View this question
A researcher collects data on hours of sleep and GPA for 150 college students. Which analysis is most appropriate to examine the relationship between these variables?
0%
0%
0%
0%
View this question
An HR analyst wants to compare job satisfaction scores (quantitative) between remote and in-office employees. Which test should the analyst use?
0%
0%
0%
0%
View this question
Why is it important to interpret both the p-value and the effect size in a correlation analysis?
0%
0%
0%
0%
View this question
If a study results in a p-value of 0.03 and the significance level (α) is 0.05, what should the researcher conclude?
0%
0%
0%
0%
View this question
What is the null hypothesis in a Chi-Square test of independence?
0%
0%
0%
0%
View this question
The following frequency distribution depicts scores on a questionnaire representing how close people feel to their mothers. Higher scores indicate a higher quality relationship. According to this frequency distribution, what percentage of people (not including NAs) had a score of 14? Round to the nearest whole number.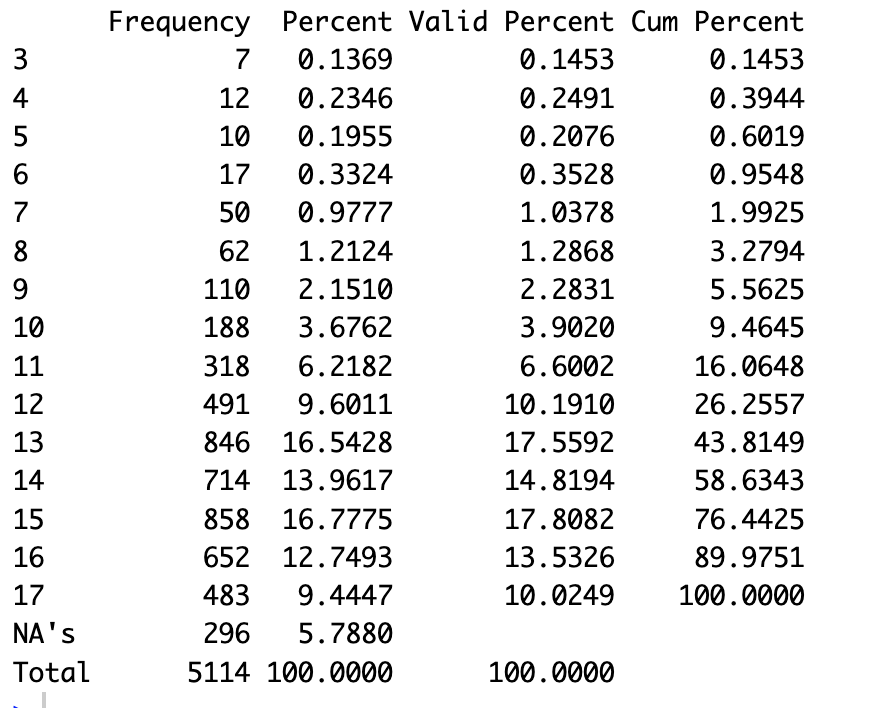
0%
0%
0%
0%
View this question
You run an analysis looking at the relationship between the type of party event and party attendance. Here is the relevant info you need:
- Explanatory variable:
Event Type
(Bowling vs Movie vs Clown) - Outcome Variable: Number of attendees
- P-value: .04
What can you conclude based on this result?
View this question