Crowdly
Add to Chrome
The table shows, for some particular year, a listing of several income levels an...
✅ The verified answer to this question is available below. Our community-reviewed solutions help you understand the material better.
The table shows, for some particular year, a listing of several income levels and, for each level, the proportion of the population in the level and the probability that a person in that level bought a new car during the year. Given that one of the people who bought a new car during that year is randomly selected, find the probability that that person was in the indicated income category. Round your answer to the nearest hundredth. 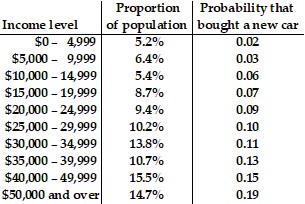 $50,000 and over
0%
0%
0%
0%