Crowdly
Add to Chrome
This question is based on the following diagram. Which of the following...
✅ The verified answer to this question is available below. Our community-reviewed solutions help you understand the material better.
This question is based on the following diagram.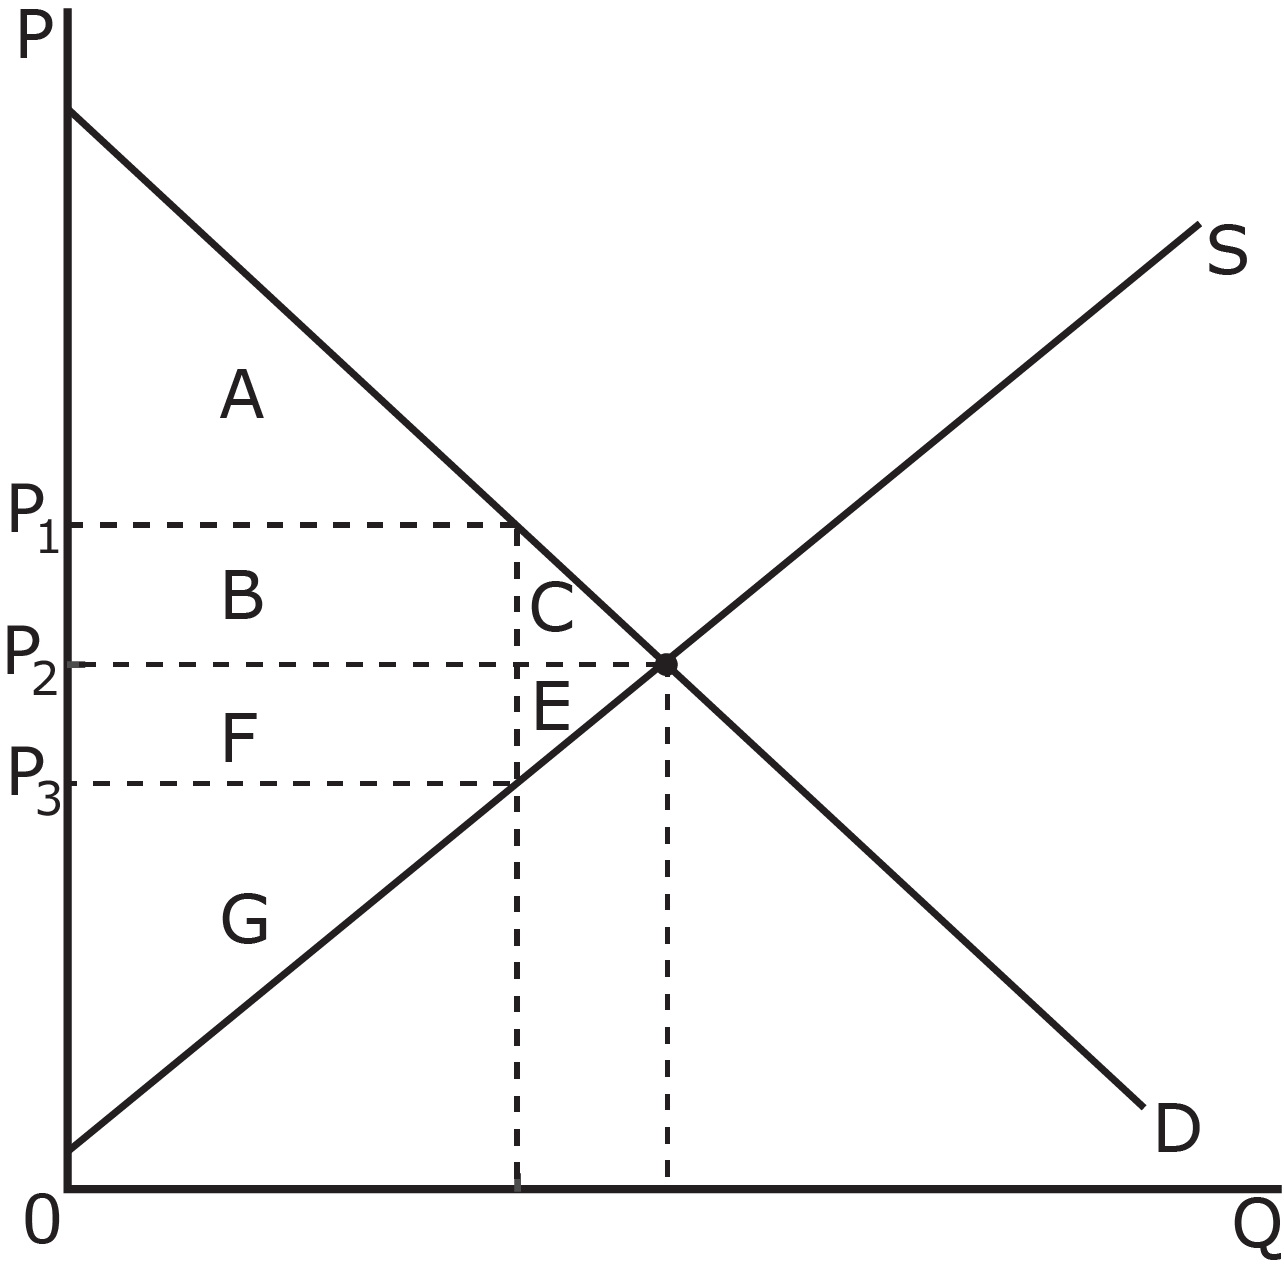 Which of the following areas represent the change in producer surplus when the price falls from P2 to P3?
0%
0%
100%
0%