Crowdly
Add to Chrome
Identify the two problem in this visualisation. Fig_13
✅ The verified answer to this question is available below. Our community-reviewed solutions help you understand the material better.
Identify the two problem in this visualisation. 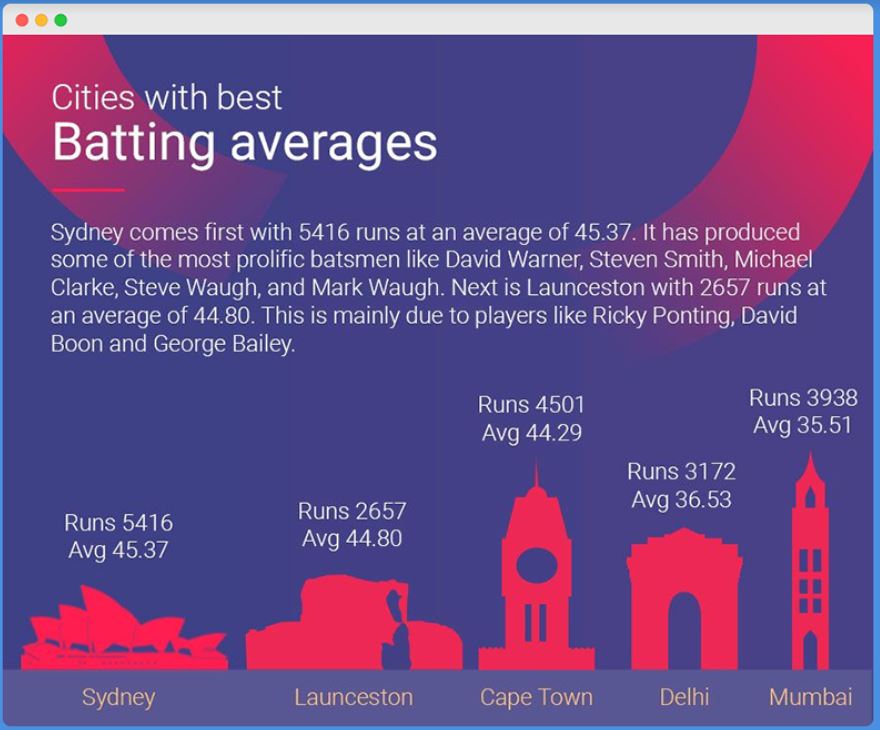 Fig_13
✅
✅
❌
✅