Crowdly
Додати до Chrome
The graph below shows a stock price rising faster than its moving average in th...
✅ Перевірена відповідь на це питання доступна нижче. Наші рішення, перевірені спільнотою, допомагають краще зрозуміти матеріал.
The graph below shows a stock price rising faster than its moving average in the first 25 days, approximately, then as shown by the arrow, the actual price breaks through the moving average. As it relates to technical analysis to support a buy/hold/sell decision for an equity position, which of the following statements is most reasonable at the point in time represented by the arrow?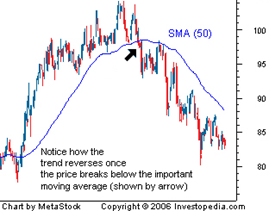
0%
100%
0%
0%
0%