Crowdly
Add to Chrome
Los intervalos en donde la gráfica de la función es cóncava hacia abajo ...
✅ The verified answer to this question is available below. Our community-reviewed solutions help you understand the material better.
Los intervalos en donde la gráfica de la función 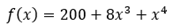 es cóncava hacia abajo son
100%
0%
0%
0%
0%